Market Indicators: Bitcoin Dominance
Why Most Newcomers Ignore It and Pay for It Every Cycle

If you are new to crypto, Bitcoin Dominance (BTC.D) is one of the most important indicators you can learn. It is simple, but it tells you where you are in the market cycle.
Most beginners ignore it, get caught in the wrong assets at the wrong time, and wonder why they get rekt even during bull markets. Here is what you need to know:
What Is Bitcoin Dominance
Bitcoin Dominance is the percentage of the total crypto market cap that belongs to Bitcoin.
A simple example:
If the whole crypto market is worth 2 trillion and Bitcoin alone is worth 1 trillion, then BTC.D is 50 percent.
You do not need any technical understanding beyond this. It is simply Bitcoin’s market share compared to the entire crypto market.
Why BTC.D Matters
Crypto moves in cycles, and Bitcoin Dominance shows you which part of the cycle you are in.
In times of bull market confidence and market certainty, BTC.D usually rises because capital flows into the most trusted and proven asset first.
When BTC.D is high or rising, Bitcoin is leading the market. Altcoins lag behind or move slowly.
When BTC.D drops sharply, this is usually the short altseason window where liquidity rotates away from Bitcoin into altcoins.
Understanding this alone protects newcomers from making the classic mistake of entering altcoins too early or too late.
How BTC.D Behaves in Each Cycle Phase
Early Cycle: BTC.D climbs
Smart money accumulates Bitcoin. It is the safest entry point. Altcoins are quiet or losing value. Bitcoin carries the market forward.
Mid Cycle: BTC.D stays high
Retail starts entering, headlines return, and excitement builds. Even then, Bitcoin still leads most of the gains. Large caps begin to move but smaller alts remain weak.
Late Cycle: BTC.D falls sharply
This is the true altseason period. It often lasts only a few weeks. Liquidity shifts into altcoins, even weak ones. Everything pumps, then everything crashes even harder once the cycle ends.
If you enter late, you hold bags for years.
BTC.D Data and History
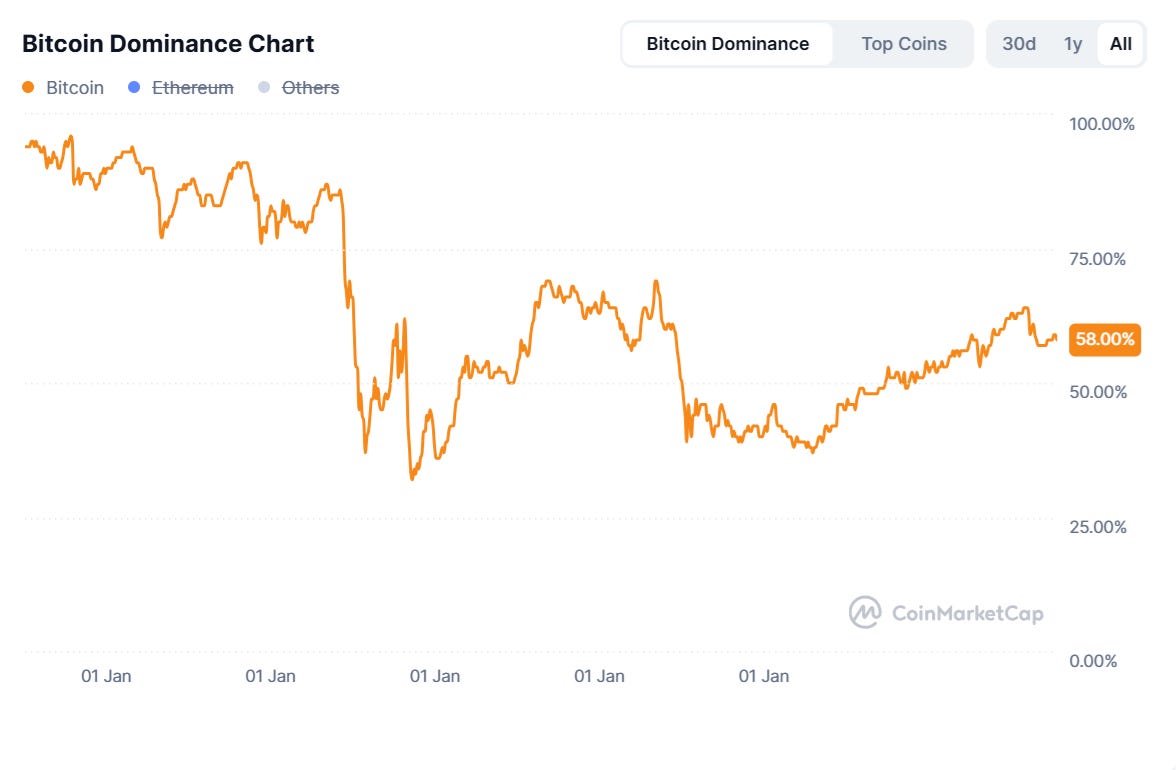
Current BTC Dominance is around 58 to 59 percent depending on the source.
Looking back:
During the 2017 ICO mania, BTC.D dropped to around 38 percent, signaling a full altseason.
When the 2018 bear market hit, BTC.D rose back to around 70 percent as capital fled risky assets.
In 2021, dominance again dropped toward the mid 40s during the major altseason period before rising back up.
Today, BTC.D is high again which historically means Bitcoin is the asset leading the cycle.
These patterns repeat because Bitcoin is still the anchor of the entire market.
A Truth Learnt The Hard Way
Bitcoin has gone through regulatory attacks, exchange collapses, multi-year bear markets, and extreme volatility. Yet so far, it has recovered every single time and eventually reached new all time highs.
Altcoins have not.
Many promising altcoins from previous cycles never recovered. Some disappeared. Narratives change, projects die, and the majority of altcoins lose most of their value after the hype phase ends.
This does not mean Bitcoin is perfect or guaranteed. It simply means history has shown one asset consistently surviving each cycle, while most others do not.
What BTC.D Is Really Telling You
When dominance is high or rising, the majority of the safe and predictable gains are in Bitcoin.
When dominance starts falling fast after a long rise, that is the short altseason window.
If you miss that window, altcoins become extremely risky again.
BTC.D is one of the clearest maps you can use to navigate the entire crypto cycle.
Final Takeaway
If you want to stay long enough to win, let Bitcoin be the foundation of your portfolio. It gives exposure to upside while limiting downside. Altcoins offer explosive returns but only a handful of them in a very small part of the cycle.
The rest of the time, they bleed.
Not Financial Advice